3 Stats To Help You Survive This Holiday Season
As Americans gear up to gobble down turkey en masse in the name of Thanksgiving, advertisers in the U.S know that as soon as the last apple pie is put down, the biggest shopping season of the year kicks off.
As retailers brace themselves for stampedes of shoppers, we’ve rounded up a list of trends and insights to help prepare you for this holiday season.
This year there’s less time to shop!
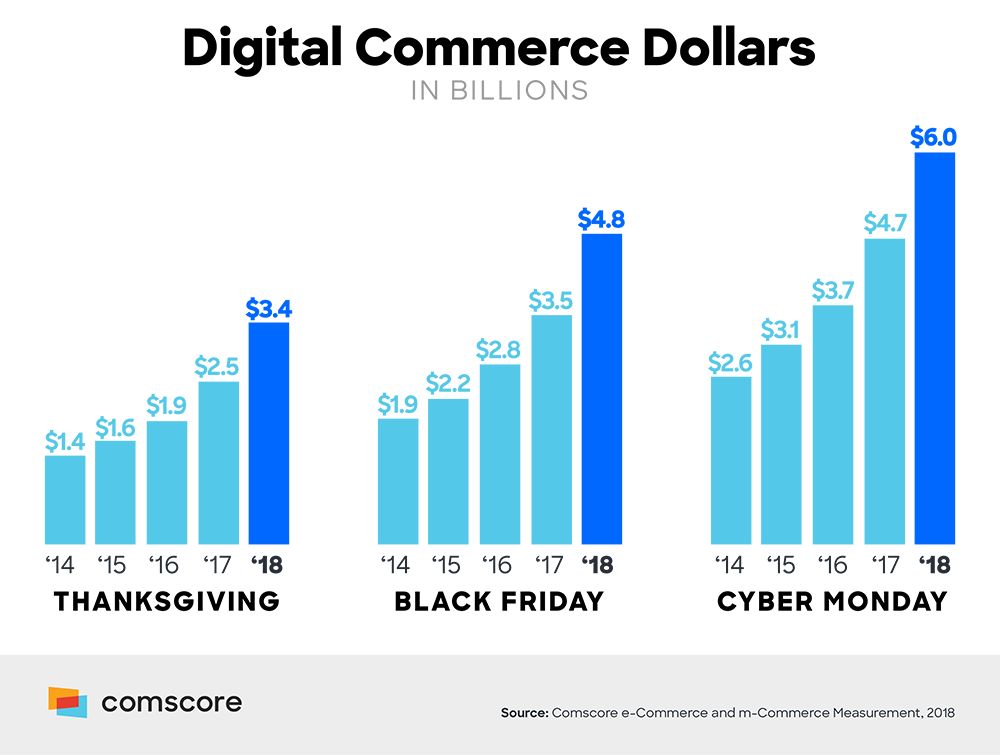
Black Friday may attract a lot of headlines. But when it comes to shopping online, Cyber Monday is more prominent. Over the past 5 years, Cyber Monday has brought in the majority of the digital commerce sales in the U.S over the Thanksgiving and Black Friday shopping season.

Every year since 2014, spending has grown, and this year it looks set to hit another record. U.S online shopping alone is projected to reach over $143.7Bn during November and December – a 14% increase from last year, according to Adobe.
Thanksgiving happens to fall much later in the month than usual this year. This means there’s a shorter time period for consumers to do their holiday shopping. With a shorter window this year, Adobe predicts every day in November and December will result in over $1Bn in revenue.
Although Cyber Monday and Black Friday remain the main drivers of sales, more and more people are shopping earlier every year. Digital consumer spending also gets earlier every year, with many businesses launching “Pre-Black Friday” deals before Thanksgiving.
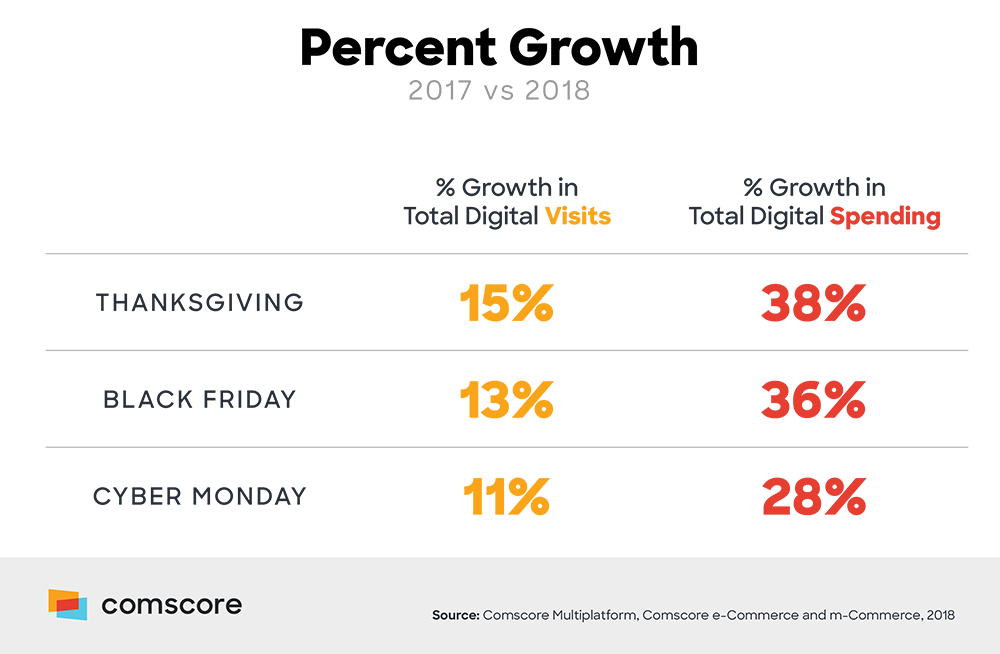
According to Comscore stats, the percentage growth in total digital spending increased by 38% in 2018 on Thanksgiving Day versus 36% on Black Friday and only 28% on Cyber Monday.

Mobile has transformed the holiday shopping experience
The mobile shopping experience has come a long way over the past few years. So it should come as no surprise that mobile shopping has become one of the key drivers of holiday sales. According to Adobe, Americans will spend $14Bn more this holiday season on mobile than last year.
Consumers also often shop for lower-priced items through their mobile devices, while purchases that require more research are made on desktop. According to Barilliance, compared to desktop purchases, consumers spend 21% less on electronic and apparel purchases on smartphones.

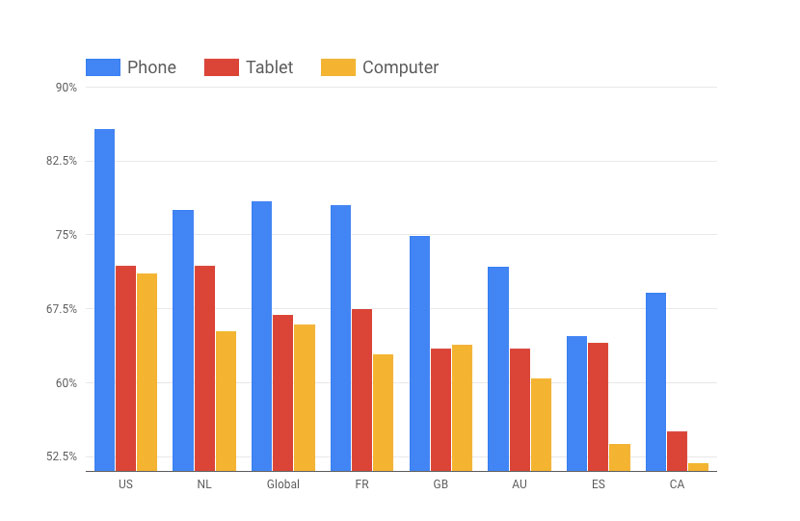
One thing to note is that while mobile accounted for 49% of all orders, cart abandonment was also high. In 2018, the global average for cart abandonment rate is 78% on mobile devices and 86% in the U.S. alone.
Christmas comes early in adland
The winter holidays are a huge opportunity for advertisers. According to Advertising Cloud, CPM costs are up 23% during the holiday season of 2018. The age-old saying of “gotta spend money to make money” applies in this situation as it turns out that 52% of consumers agree that seasonal ads are more appealing than standard ads.
There is also a 30% increase in viewable completion rates during the holiday season. Almost half (47%) of consumers also agree that ads during the holiday season are more relevant than ads they see throughout the year.
Research from the IPA recently revealed that emotional ad campaigns are more effective and more profitable than rational ad campaigns, while a Nielsen study found that ads with above-average EEG scores delivered a 23% lift in sales volume.
And this is certainly true of ads that appear over the festive season, which on average were more likely to have an impact on business metrics and long-term ROI.
Research we carried out using our proprietary testing tool UnrulyEQ also found that the rate of people expressing an interest in buying products (purchase intent) is 13% higher for holiday ads than other ads. Consumers are also 7% more likely to share holiday ads, while brand value is also 13% higher.
Speak to our team to find out more about our seasonal audiences
